AMERICA’S FAVORITE DRINK
What America Is Drinking:
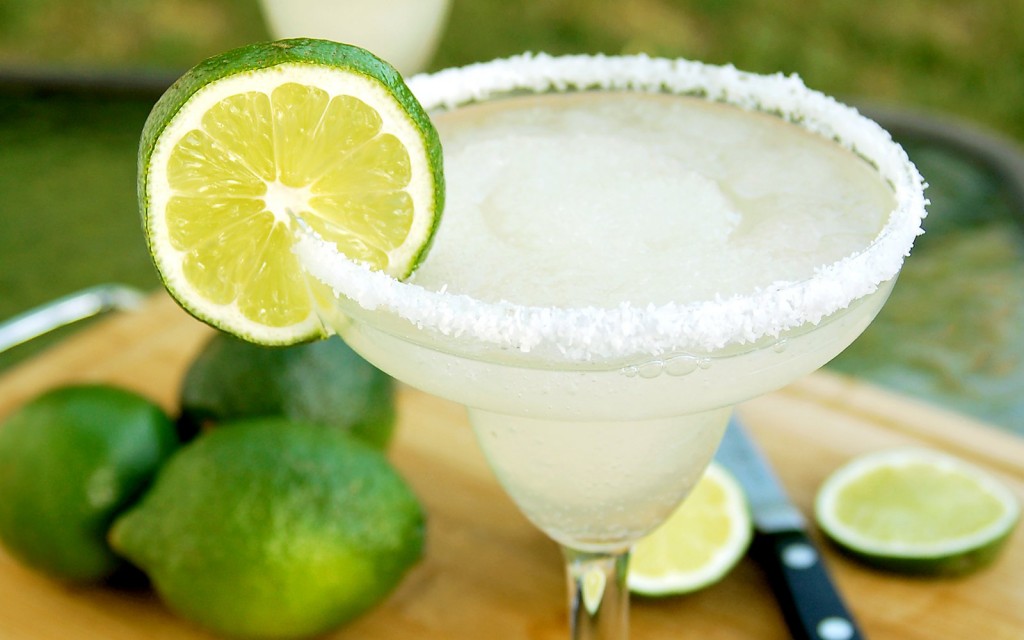
Margarita Tops The List Of America’s Favorite Cocktail
Continuing Nielsen’s vision toward total consumer measurement, today, Nielsen CGA, a joint venture between Nielsen (NYSE: NLSN) and CGA Strategy, released insights from their first On-Premise Consumer Survey for the U.S. market.
The Nielsen CGA On-Premise Consumer Survey is a biannual survey of 15,000 on-premise consumers, all of legal drinking age, aimed to provide a comprehensive look into America’s eating and drinking habits in restaurants and at bars. This first U.S. market survey, which is nationally representative of age, gender and location (state), uncovers rich consumer sentiment data that speaks to all aspects of on-premise usage. Drilling down to gain in-depth insight into drinking trends, tastes, occasionality, chain usage and drink brand preferences, this survey can reveal: the cross-over between a retailer’s customers and a beverage-alcohol (BevAl) brand’s consumers, top outlets visited, occasions that drive visits (e.g., after work drink, celebration) and overall preferred drink categories and brands.
“To win in this complex on premise market, manufacturers, distributors and retailers need to gain a total consumer view and go beyond simply what is being consumed,” said Scott Elliott, SVP Nielsen CGA. “Essentially this means gaining insight into who is buying what, where, why and crucially—what they do when they are not engaging with your brand. Together with TD Linx and our best-in-class measurement and analytic services, this sentiment data completes the Nielsen CGA circle of on-premise insight capabilities. This unique 360-degree approach, combined with our world-leading, on-premise consultancy credentials, means Nielsen CGA customers can start to forge new, differentiated, approaches to winning in the on-premise space.”
The Nielsen CGA On-Premise Consumer Survey is available now for Nielsen clients.
A SNAPSHOT OF AMERICA’S EATING AND DRINKING HABITS IN RESTAURANTS + BARS:
General Fan Favorites
- 23% of the U.S. population have drunk a cocktail out of home in the last 3 months
- Tequila (44%) is the favorite liquor base for cocktails in the U.S., followed by: light rum (39%), flavored Vodka (39%), non-flavored Vodka (39%) and whiskey (27%)
- Margarita (60%) is the most popular cocktail in the U.S., followed by: Daiquiri (44%), Piña Colada (36%), Long Island (33%) and Mojito (29%)
- 48% of consumers feel that cocktail menus with named liquor brands are very important or important when choosing a cocktail
Fan Favorites: by Retail Chain
- Chilli’s® consumers are 7% more likely to try a margarita (67%) than the U.S. average (60%)
- Buffalo Wild Wings® consumers are 7% more likely to try a Tequila Sunrise (34%) than the U.S. average (27%)
- Bonefish Grill consumers are 13% more likely to try a martini (39%) than the U.S. average (26%)
- TGI Fridays℠ consumers are 8% more likely to try a Mojito (41%) than the U.S. average (33%)
How much are Americans willing to pay for a cocktail when out?
- $8.72 for a standard cocktail
- Consumers are willing to pay 25% more for a cocktail made with premium spirits;
the average willingness to spend: $10.98
A hunch about brunch
- Around six in 10 Americans are likely to drink alcohol with brunch
- 24% of those who eat out at Brunch will drink a cocktail: 45% of brunchers would often order Mimosa, 36% a Bloody Mary and 27% a Champagne cocktail
